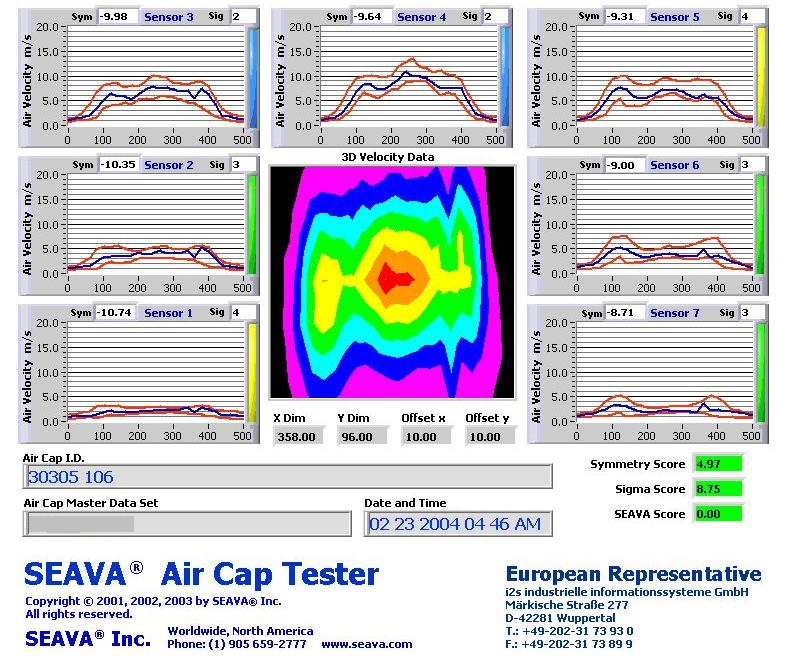
A SEAVA® graph is a
colorful, 3 dimensional representation of air
velocity. The X-scale is the position of the
applicator, the Y-scale represents the sensor number
(also the height of the pattern), and the colors (or
Z-scale) represent velocity, with white, red, and
orange being the higher velocities, and blue, purple
and black being the lower velocities.
In the test above, each sensor’s data is compared to
a master tolerance window, and classified as A, B,
or C quality. The blue bars on the graphs say this
was an A quality air cap.
SEAVA® data is similar to film-build data. When
compared to film thickness data in a 3D format, the
results are almost identical.
|
|
|